
Figure 3.
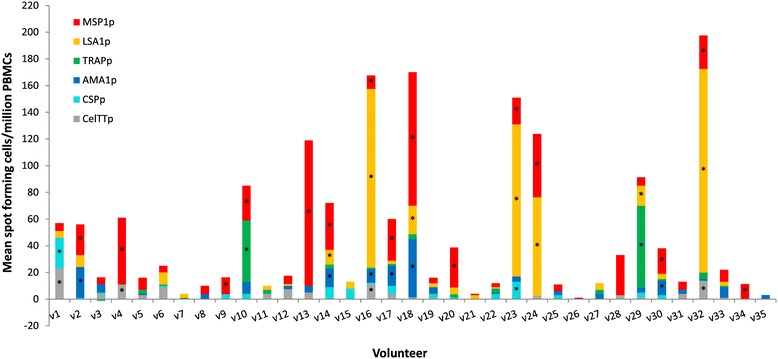
Magnitude of IFN- γ responses to CelTTp and the five other malarial antigens. For each volunteer, stacked bars represent responses to the six single pools and bars with asterisks (*) are positive responses as defined in the Methods. The plotted data are those over the medium background responses (difference between activities for test peptide-stimulated PBMCs and unstimulated control PBMCs).