
Figure 3.
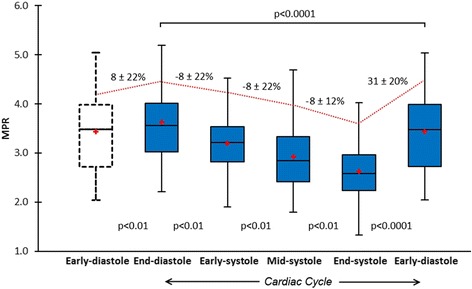
Cyclic variation in MPR. Mean MPR in healthy volunteers (n = 30) showed significant cyclic variation throughout the cardiac cycle (p < 0.0001). Box plots for MPR show the interquartile range (box), median (dividing black line) and mean (red cross) with whiskers extending to 1.5 x interquartile range. There were successive reductions from end-diastole to early-, mid- and end-systole, and a significant increase from early- to end-diastole (all p values <0.01) (trend shown by red line). The maximal interval change in MPR was between end-systole and early diastole (31% increase). MPR = myocardial perfusion reserve.