
Figure 3.
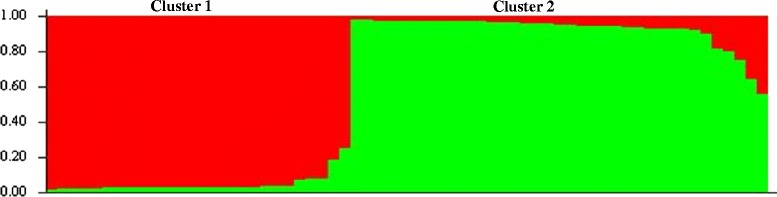
Bayesian cluster analysis of P. falciparum singly-infected samples collected from Puerto Lempira, Honduras (N = 65). The predicted number of likely clusters (K) for the samples was K = 2. Each color corresponds to a population cluster as classified by Structure v2.3.3, and each individual isolate is represented by a vertical bar. The Y axis represents the estimated proportion of membership of an individual to each population.