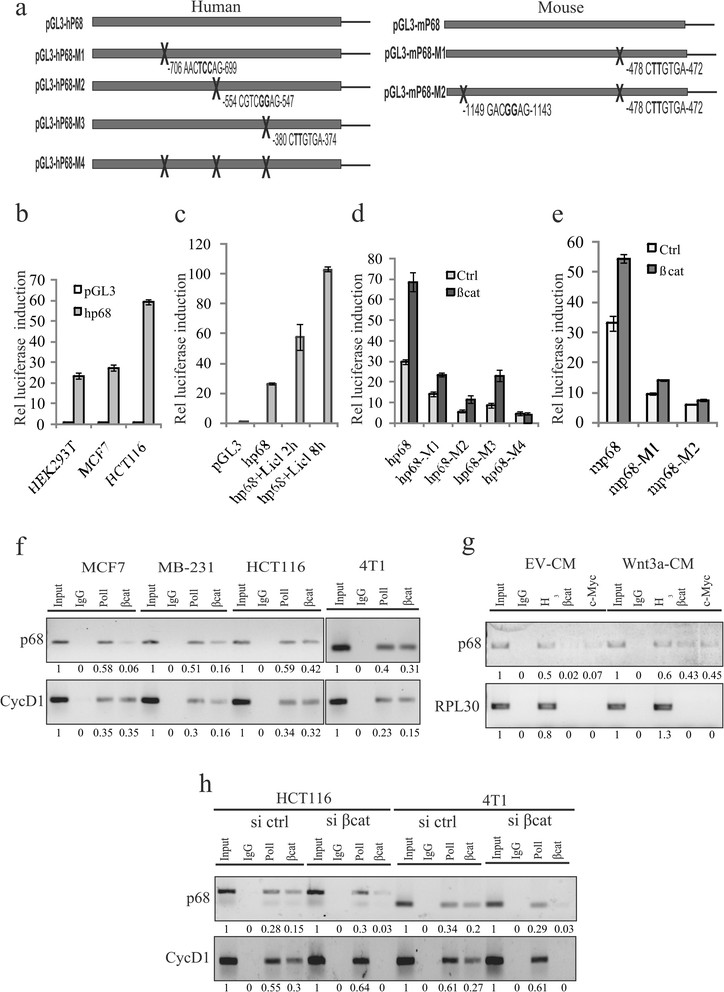
Figure 5.

β-catenin/TCF4 as well as c-Myc regulates p68 promoter. (a) Schematic representation of human and mouse p68 promoters. (b) Activity of human p68 promoter (pGL3-hp68) was determined by luciferase assay in HEK293T, MCF7 and HCT116 cells after 36 h of transfection. Values represent the firefly luciferase activities normalised to renilla luciferase activities. (c) Similarly, pGL3-hp68 activity was determined in MCF7 cells treated with 20 mM lithium chloride (LiCl) for 2 h and 8 h. (d) Luciferase activities were determined in MCF7 cells transfected with human wild-type pGL3-hp68, or mutated transcription factor 4 (TCF4) constructs like pGL3-hp68-M1, pGL3-hp68-M2, pGL3-hp68-M3 and pGL3-hp68-M4 independently, along with pEGFP-β-catenin. (e) Mouse p68 promoter (pGL3-mp68) activities were determined in MCF7 cells transfected with either wild-type pGL3-mp68 or mutated TCF4 sites containing constructs pGL3-mp68-M1 and pGL3-mp68-M2 independently along with pEGFP-β-catenin. (f) Cross-linked chromatin fragments of MCF7, MDA-MB 231 and HCT116 (human) as well as 4T1 (mouse) cells were immunoprecipitated with respective antibodies as depicted in the figure. DNAs were isolated and PCR-amplified using primer sets designed from the promoter regions of p68 and cyclin D1 genes. Densitometry values are given below the images. (g) MCF7 cells were treated with either Wnt3a-CM or empty vector (EV)-CM (control). DNAs were isolated from cross-linked chromatins immunoprecipitated with the indicated antibodies and PCR-amplified using primer sets designed from the promoter regions of p68 and RPL30 genes. Densitometry values are given below the images. (h) β-catenin was knocked down in HCT116 and 4T1 cells using small interfering RNA (siRNA). Control siRNA (si ctrl)-transfected cells were kept as control. DNA fragments were isolated from cross-linked chromatins immunoprecipitated with the indicated antibodies and PCR-amplified using primer sets designed from the promoter regions of p68 and cyclin D1 genes. Input: 2.5% (f and g) or 5% (h) of total DNA isolated from cross-linked chromatin without immunoprecipitation. Densitometry values are given below the images.
