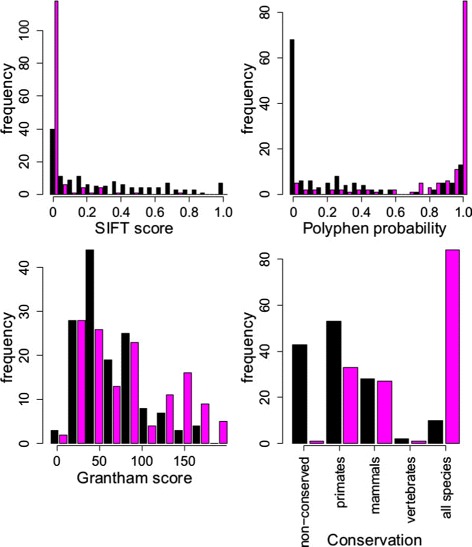
Figure 1.

Comparison of the distributions of predictor variables for benign and pathogenic variants. Histograms depict the numbers of variants that are pathogenic (magenta bars) and benign (black bars) with predictor values within a range as indicated on the x-axes for the four predictor variables. Conservation categories are defined in the Methods section.
