
Figure 3.
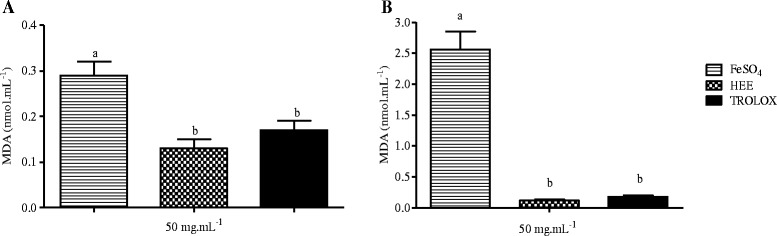
Effect of HEE (50 μg/mL) on lipid peroxidation induced by AAPH (A) and FeSO 4 (B). The results are shown as the concentration of malondialdehyde formed (nmol/mL). Values are expressed as the mean ± SD. Different letters on the graph stand for statistical difference between the groups. The statistical analysis was carried out using one-way ANOVA, followed by Bonferroni post-hoc test (p <0.05). All experiments were performed in triplicate.