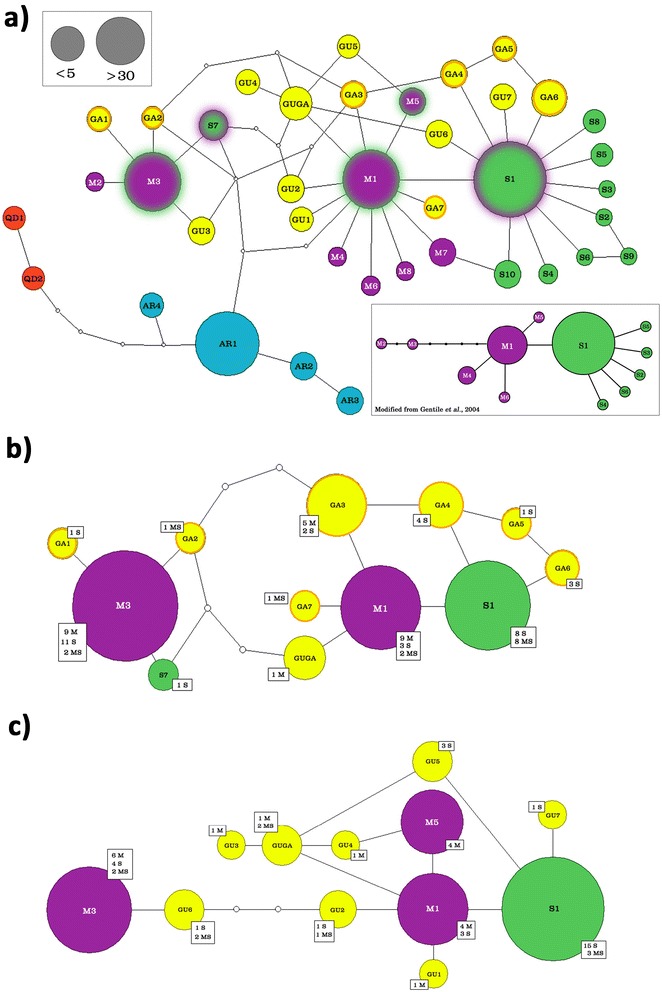
Figure 2.

Parsimony-based networks of genealogical relationships among VGSC Intron-1 haplotypes in the Anopheles gambiae complex. a) Network built with original data collected from all studied species of the A. gambiae complex, with the exception of Anopheles melas and Anopheles merus, whose haplotypes exceeded the 95% threshold of TCS connection limit. Haplotypes are represented by pies whose sizes are proportional to frequencies in the sample and coloured as follows: blue = Anopheles arabiensis (AR), red = Anopheles quadriannulatus (QD), violet = Anopheles coluzzii, green = Anopheles gambiae (haplotypes are named and numbered according to Gentile et al. [23]), yellow = private haplotypes from either Guinea Bissau (GU), The Gambia (GA), or from both Countries (GUGA); sequential codes are used to name A. coluzzii (i.e. M7, M8) and A. gambiae (S7-S10) novel haplotypes not exclusive to The Gambia and Guinea Bissau; M1, M3, M5, S1 and S7, which are not completely segregated between the two species in the Far-West and/or Rwanda, are shaded. Below: VGSC Int-1 network for M (A. coluzzii) and S (A. gambiae) molecular forms as in Gentile et al. [23]; b) and c) networks only including A. coluzzii, A. gambiae and hybrids haplotypes from The Gambia and Guinea Bissau, respectively. White squares report numbers of alleles for A. coluzzii (M), A. gambiae (S) and hybrids (MS) (identified based on SINE-PCR [26]) included in each haplotype.
