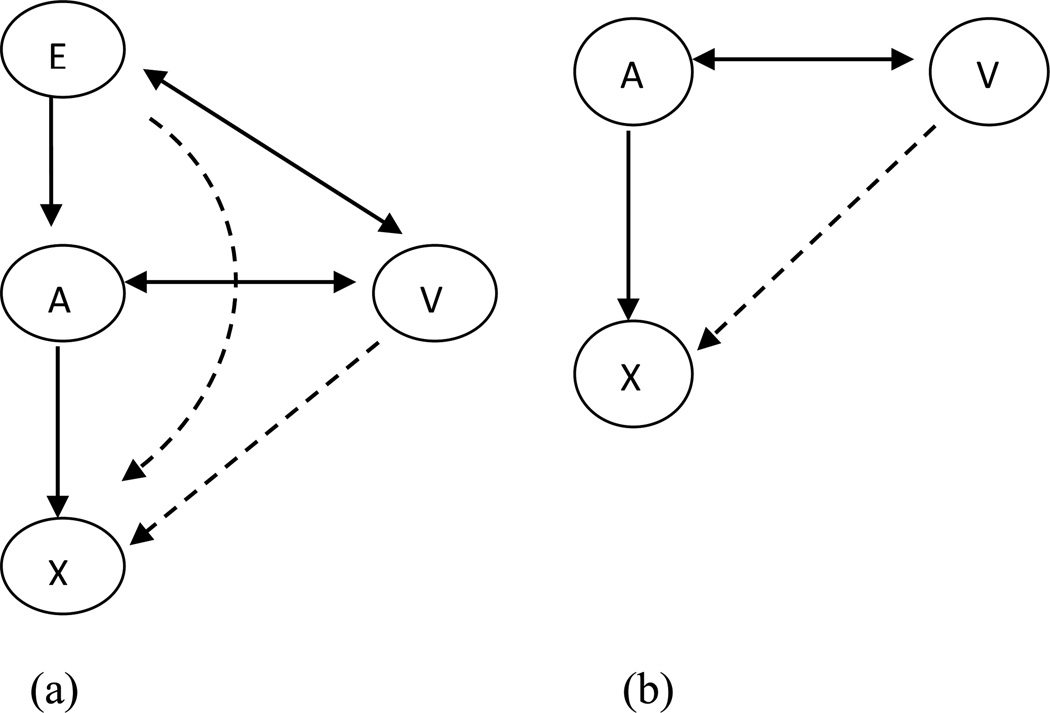
Figure 1.
Measurement bias and response shift in measurement model used in the present study.
E: explanatory variables (e.g., depression, treatment strategies); A: latent factors (e.g., General Physical and General Mental); V: confounding variables (e.g., age; sex); X: observed variables (e.g., physical functioning; social functioning; mental health scale scores).
The double-headed arrow represents correlations between all E and V variables and/or correlations between all V variables and A. Dashed arrows represent measurement bias/response shift in measurement. Single-headed arrow represents direct effects of E on A or A on X.
Adapted with permission from Oort FJ, Visser MRM, Sprangers MAG. Formal definitions of measurement bias and explanation bias clarify measurement and conceptual perspectives on response shift. J Clin Epidemiol 2009;62:1126–37.

