
Figure 4.
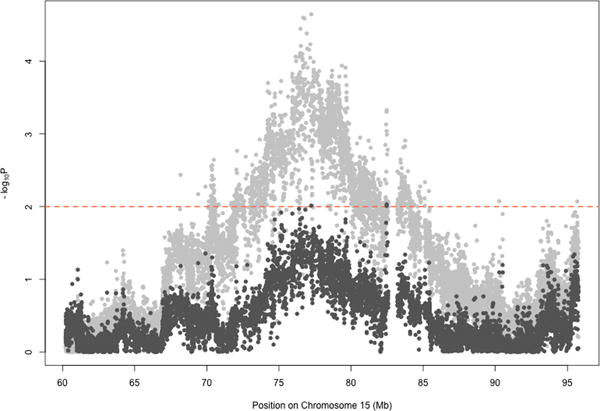
Conditional analysis of SCAPER region on rs55817928. The original results from the extended model for local ancestry association are shown in light grey. After adjusting for the genotype of imputed SNP rs55817928 within the extended model, the association results of local ancestry are shown in dark gray. P-values are significantly decreased after inclusion of the one imputed SNP in the model, indicating that some of the local ancestry signal was due to rs55817928, or another SNP in strong linkage disequilibrium with this SNP.