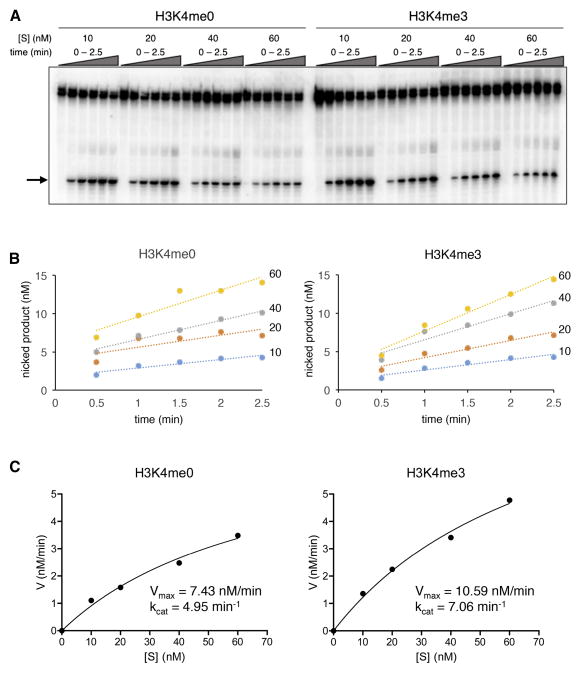
Figure 4.
Disruption of the RAG-2 autoinhibitory domain mimics the stimulatory effect of H3K4me3 on catalytic rate. (A) Assay for RSS nicking. Reactions contained 1.5 nM RAG-2(388/405A18) and 12-RSS substrate HL44/45 at 10, 20, 40 or 60 nM. Reactions were supplemented with 4 μM H3K4me0 or H3K4me3 peptide as indicated at top. Accumulation of nicked product (arrow) was assayed at times ranging from 0 to 2.5 min. (B) Concentration of nicked product as determined in (A) is plotted against time for each substrate concentration. Blue, 10 nM; orange, 20 nM; gray, 40 nM; and yellow, 60 nM. Left, reactions containing H3K4me0; right, reactions containing H3K4me3. (C) Reaction velocity (V) is plotted in nM/min as a function of substrate concentration ([S]). Vmax was determined by non-linear regression analysis (Experimental Procedures); kcat = Vmax/[RAG]T, where [RAG]T is the total concentration of active RAG tetramer. Data are representative of two experiments.

