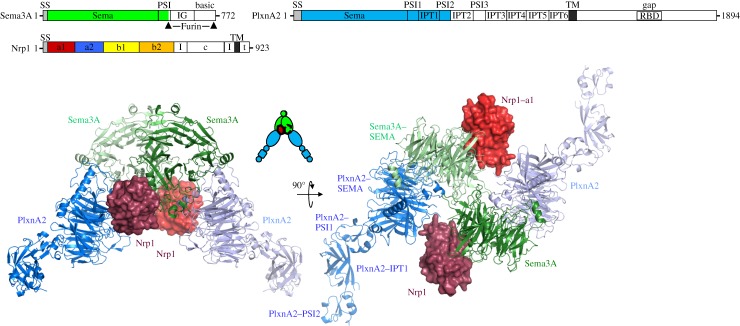
Figure 3.

The semaphorin–neuropilin–plexin complex. The schematic domain organization of mouse Sema3A, PlxnA2 and Nrp1 is presented above two orthogonal views of the structure of a semaphorin–neuropilin–plexin complex. Sema3A sema domain (green) and PlxnA21−4 (blue) structures are shown in ribbon representation and Nrp1 domain a1 structures (red) in surface representation. (Adapted from [15].)
