
Figure 12.
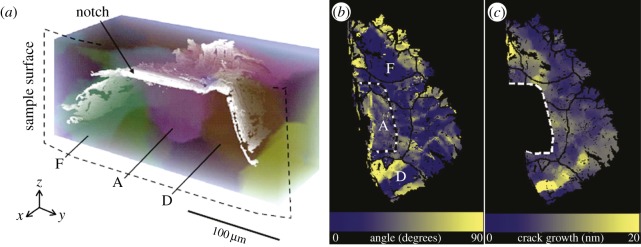
(a) Three-dimensional diffraction contrast tomography rendering of a crack (white) and Mg grains (semi-transparent colours); (b) plan view of the same crack with the starter notch (dashed), grain boundaries (lines) and specific grains labelled by letters showing the angle between the crack plane and the crystallographic basal plane; (c) local growth rate (nm per cycle) where the average rate was 9 nm per cycle [72]. (Online version in colour.)