
Figure 15.
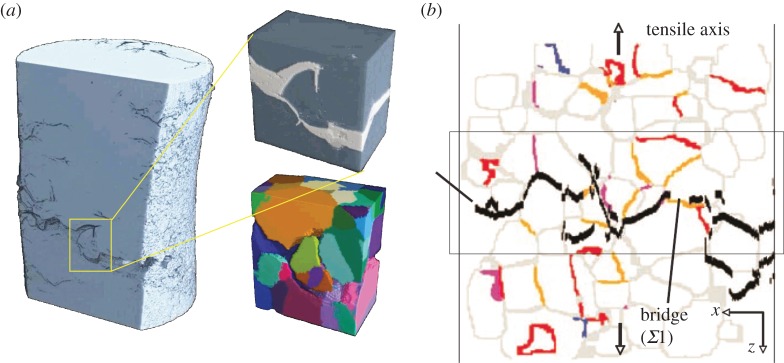
Combined use of diffraction contrast tomography (DCT) and CT data to identify crack-bridging grain boundary structure for intergrannular corrosion in a stainless steel wire. (a) Integranular cracking is evident from the segmented attenuation contrast image (top) but the relationship to the underlying grain structure is only evident from the magnified DCT image (bottom). (b) Two-dimensional section of the grain boundaries identified by DCT compared with the path identified by CT. The low-angle boundaries Σ1 (orange), Σ3 (red), Σ9 (blue) and other boundaries <Σ29 (purple) [70]. (Online version in colour.)