
Figure 16.
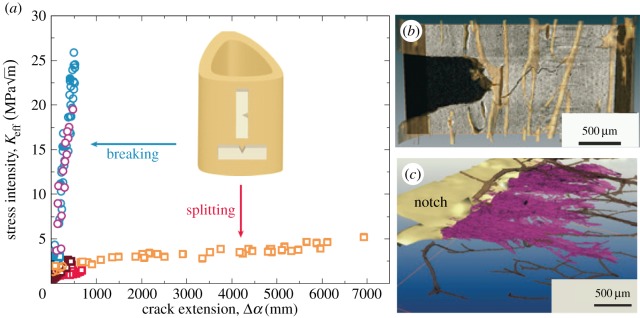
(a) Fracture toughness resistance curve data for the transverse and longitudinal orientations in hydrated human cortical bone [89] and tomographs showing the crack growth path for cracks growing (b) transverse to the axis of the bone [80] and (c) along the length of the bone [89]. In (b) crack deflection/twisting dominates and in (c) crack bridging dominates the toughening. (Online version in colour.)