
Figure 18.
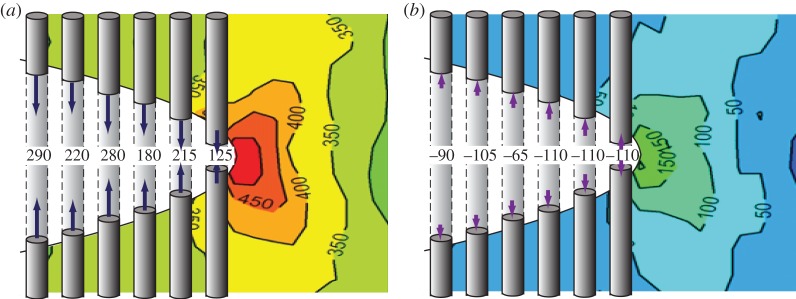
The fibre stresses measured at the fatigue crack plane shown in figure 10 for a Ti–Al–4V/35% SiC fibre composite can be considered as crack-face tractions at (a) Kmax and (b) Kmin. These crack-closing (a) and crack-opening (b) stresses are shown superimposed upon the measured continuum crack-tip stress field (in MPa; after [50]) derived by summing the stresses in each phase in their correct phase fractions. The crack length is approximately 0.35 through the width of the sample. (Online version in colour.)