
Figure 19.
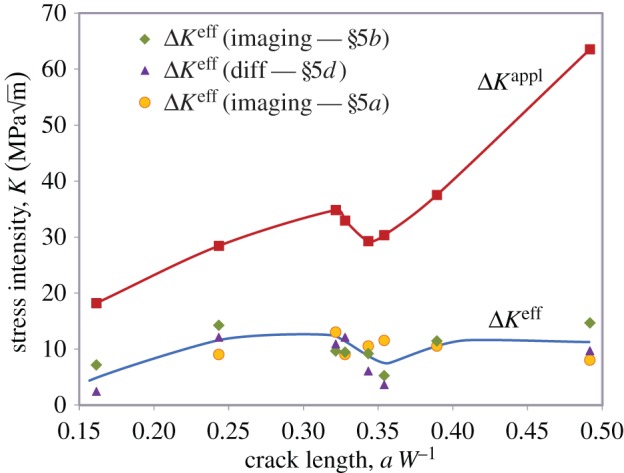
Increase in crack-tip driving force with crack length compared with that nominally applied (red squares) for a 35vol% SiC fibre/Ti alloy composite as inferred from the crack-tip stress field (orange circles) using the approach of §5a, from the stresses in the bridging fibres (green diamonds) as described in §5b and the local crack-opening displacements (purple triangles) as described in §5d. (After [49].) (Online version in colour.)