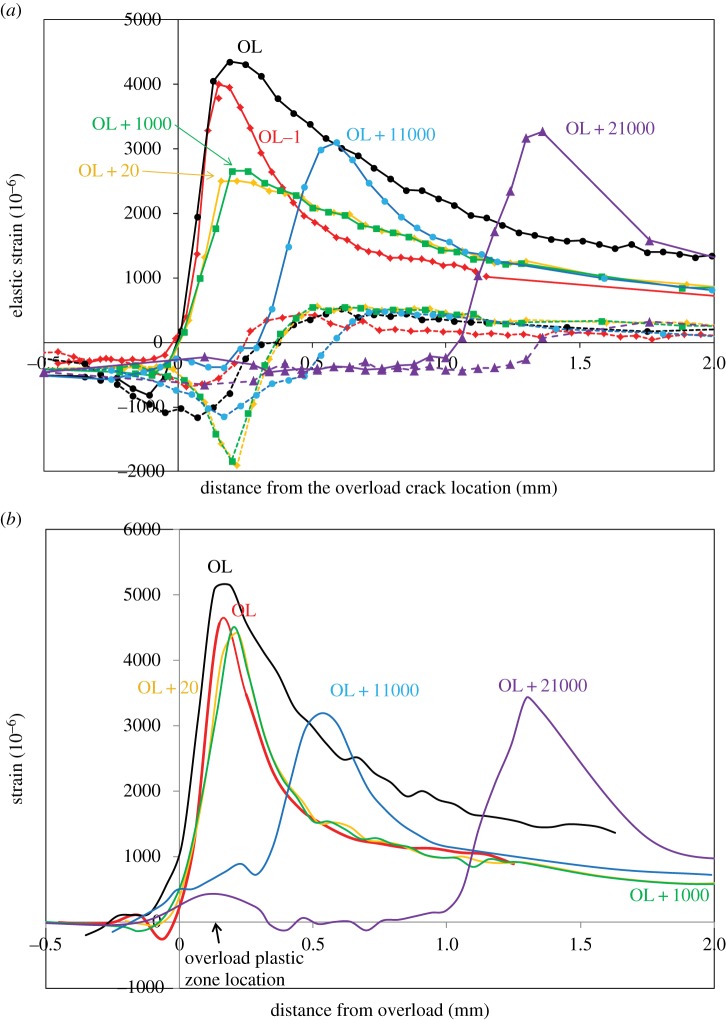
Figure 8.
(a) Crack-opening strain, εyy, profile along the crack plane (y=0) at the centre of a 15 mm thick bainitic steel CT sample at Kmax (solid line) and Kmin (dashed line; ΔK=28 MPa√m; R ratio=0.05) as a function of the number of cycles after a 100% overload (OL) event. (b) The same data plotted as the difference in elastic strain between Kmax and Kmin as a function of the number of cycles. The arrow shows the location of the extensive plastic deformation from the overload event [36]. (Online version in colour.)

