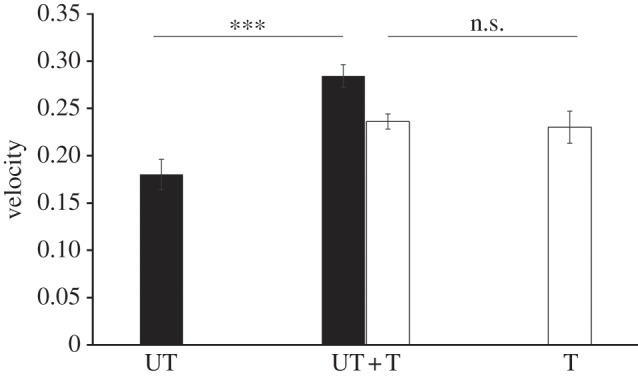
Figure 3.

Untrained fly velocity is higher in UT + T treatment compared with control treatment. Fly velocity (mm s−1) during the transmission phase for untrained (black bars) and trained flies (white bars) depending on the treatment. Error bars represent standard error of the mean. ***p < 10−3, t-test.
