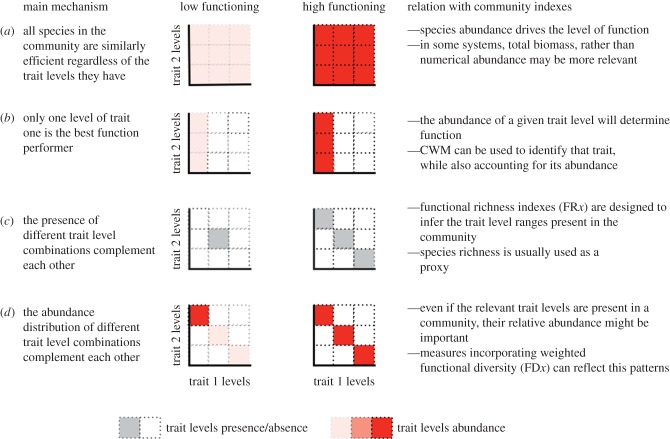
Figure 1.
Main mechanisms linking traits to ecosystem function. The x- and y-axes represent different trait levels (e.g. ‘large body size’, ‘medium body size’ and ‘small body size’). For simplicity, only two traits are presented. Darker colours indicate higher trait level abundance in the community. Different mechanisms predict that high functioning levels can be achieved by having (a) high abundance of any trait present in the community, (b) high abundance of the efficient trait level of the relevant trait, (c) the presence of complementary trait levels combinations or (d) an even distribution of complementary trait level combinations. Figures should be seen as simplified examples and other trait combinations are possible. See text for explanation for the calculation of indices.

