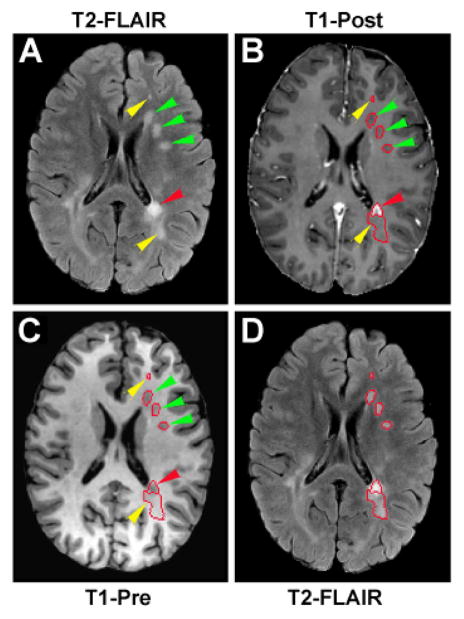
Figure 1.
An axial section of T2-FLAIR (A and D) and T1WI (B and C) showing lesion classification and ROI creation. Abnormal hyperintensities detected on T2-FLAIR image (arrowheads in A) appear as enhanced (red arrowhead in B), hypointense (green arrowheads in B and C) or isointense (yellow arrowheads in B and C) areas compared to the surrounding NAWM on T1WI. T1-hypointense lesion (green arrowheads in C) was identified by the overlapped region of hyperintense area on T2-FLAIRimage (green arrowheads in A) and hypointense area on T1-Pre image (green arrowheads in C). While enhanced region on T1-Post image delineated the active lesion (red arrowhead in B), the overlapped region of hyperintense area on T2-FLAIR image (yellow arrowheads in A) and isointense area on T1-Pre image (yellow arrowheads in C) represented the T1-isointense lesion. The whole set of ROIs was created on T2-FLAIR image (red tracks on D) and applied to parametric quantification (To illustrate, ROIs of this axial section only in the left side of the brain were presented here).

