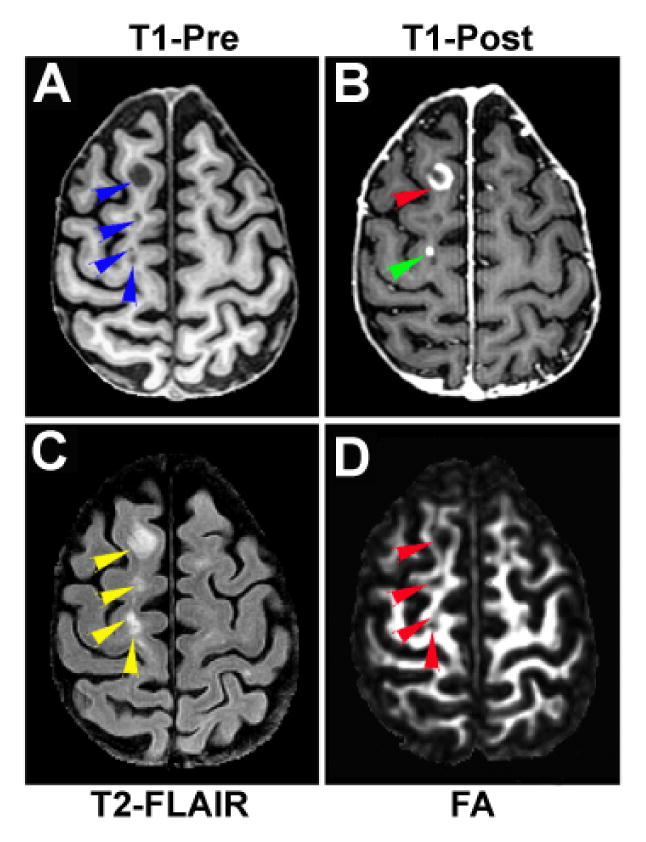
Figure 4.

Relationship between T1-enhanced and T1-hypointense region. Some areas withT1-hypointense signal on T1-Pre image (arrowheads in A) concurrently, may be the T1-enhanced regions on T1-Post image (arrowheads in B). Both T1-enhanced and T1-hypointense regions present as hyperintensities on T2-FLAIR image (comparing A, B with C). The reduced FA regions (arrowheads in D) correspond not only to the T1-hypointense lesions, but also to the adjacent active (T1-enhanced) lesions (comparing A, B with D).
