Figure 1.
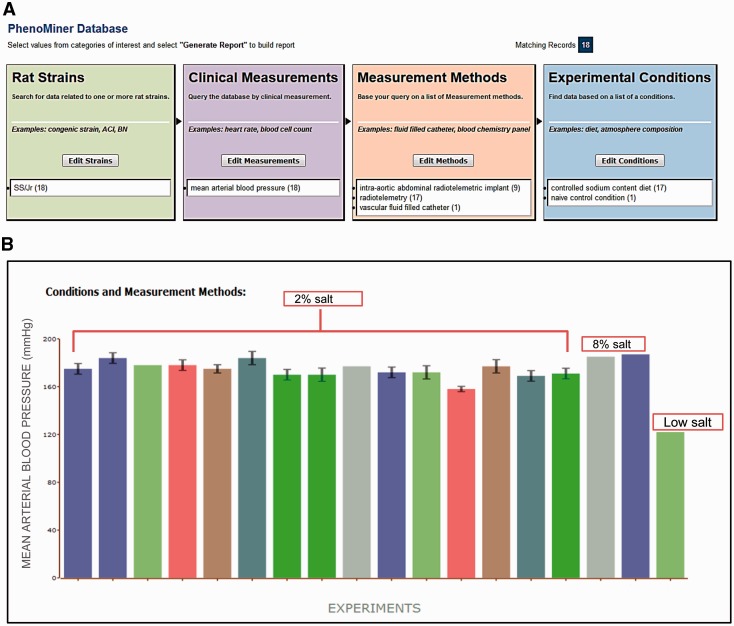
(A) Final search page before generating a report in PhenoMiner. A total of 18 records were retrieved by limiting data to four ontologies: Rat Strain, Clinical Measurement, Measurement Method and Experimental Condition. The record distribution in each ontology is shown in parentheses following the term. (B) Chart display of MAP data set generated in PhenoMiner. These records are from SS/Jr (RGD: 10041) on controlled sodium content diets: low, 2%, or 8%. Each bar represents one experiment and the experimental conditions and measurement methods associated with the experiment are color coded and explained under “Conditions and Measurement Methods.” To simplify the display, these experimental details of each bar are omitted. (Data accessed June 2014)

