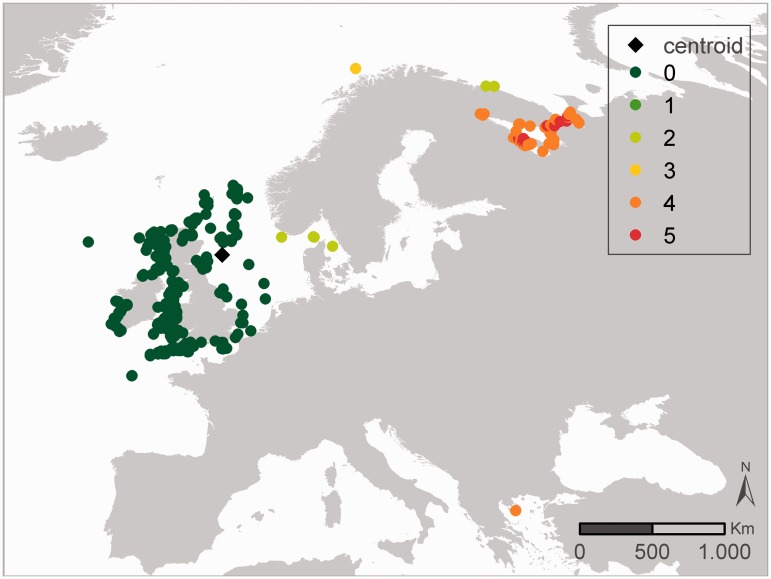
Figure 5.
Synthesis map representing the combined results of the outlier analyses of Verruca stroemia from Figure 4. The scale represents the number of times a species distribution is seen as an outlier, when combining the eight outlier analyses—geography, bathymetry, Sea Surface Salinity (SSS) and Sea Surface Temperature (SST) SSS and SST according to the IQR and MAD approach—from Figure 4. The black diamond indicates the centroid of the investigated data.

