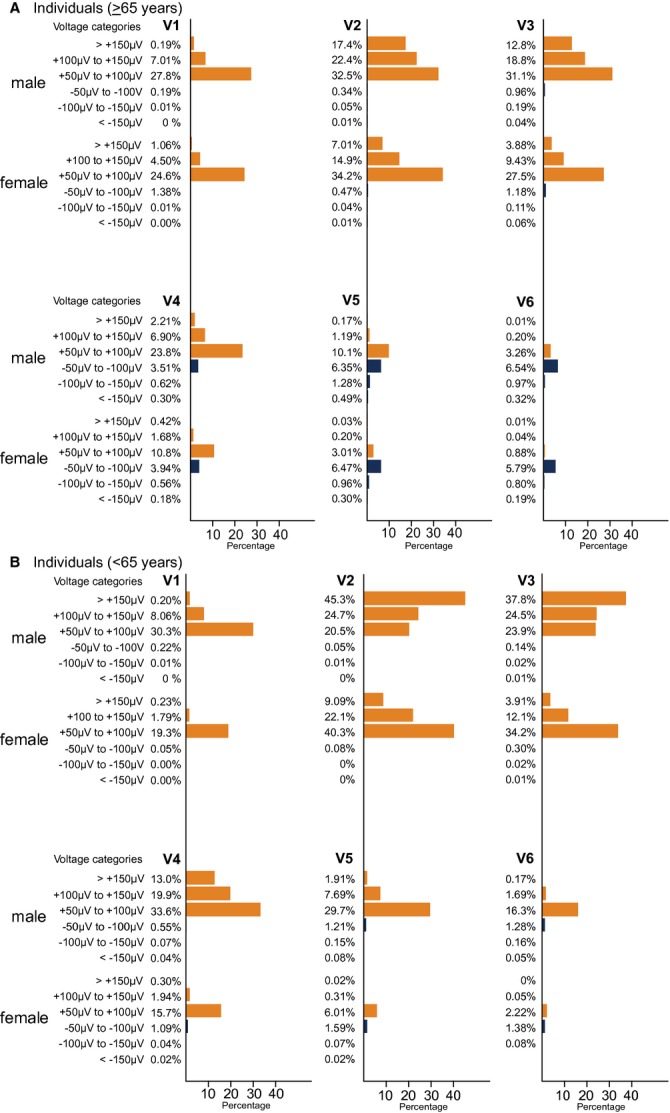
Figure 1.

Bar charts displaying the prevalences and distribution of precordial ST‐segment deviations in the different voltage categories of (≥50 to <100 μV, ≥100 to <150 μV and ≥150 μV) in the subgroup of men and women younger and older than 65 years of age. Orange bars represent ST‐elevations and blue bars represent ST‐depressions. It is supposed to be A, Old (≥65 years), B, Young (<65 years).
