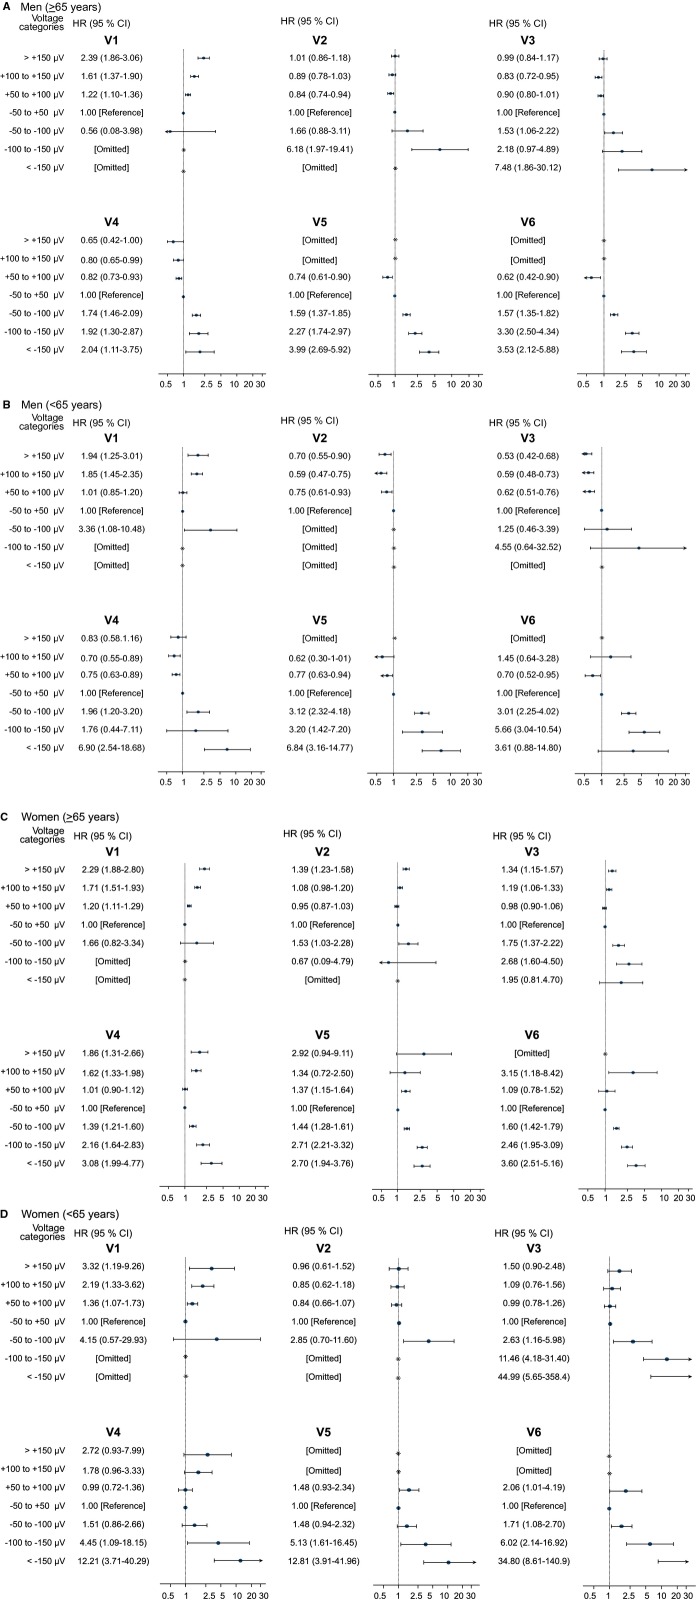
Figure 2.
Associations of ST‐segment deviation and cardiovascular death. Forest plots depicting multivariable‐adjusted hazard ratios for cardiovascular death by voltage categories (≥50 to 100> μV, ≥100 to 150> μV and ≥150 μV) with reference to an isoelectric ST‐segment. All models were adjusted for heart failure, valvular heart disease, Charlson comorbidity index (0 points, 1 point, or ≥2 points), treatment with angiotensin converting enzyme (ACE)‐inhibitors, beta‐blockers, or calcium‐antagonists prior to inclusion, digoxin at the day of ECG recording, R‐wave and S‐wave amplitude on the index ECG, and age was the timescale. The horizontal solid lines represent 95% confidence intervals and vertical lines represent a HR of 1. A, Men, old (≥65 years); (B) Men, young (<65 years); (C) Women, old (≥65 years); (D) Women, young (<65 years).

