Figure 5.

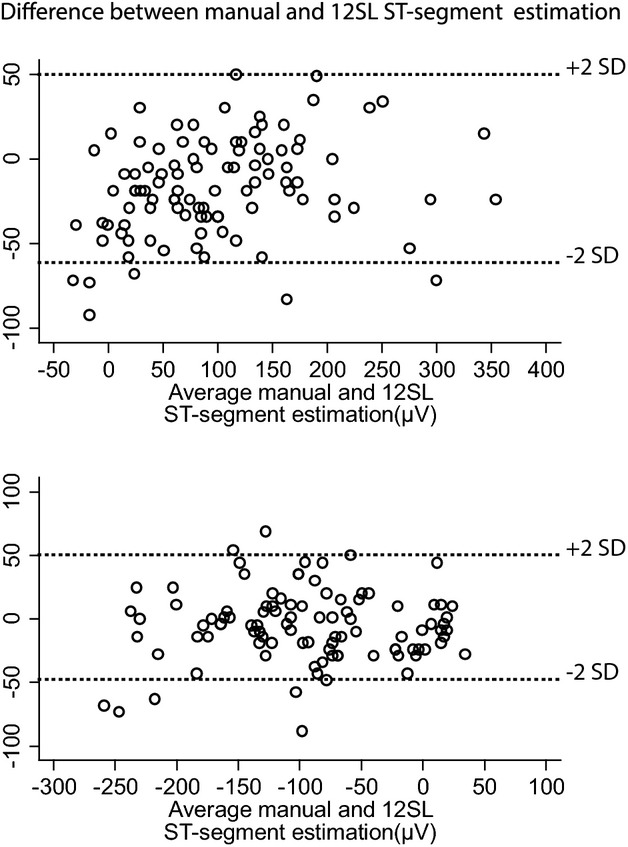
Agreement between automated ST‐segment measurements (Marquett 12SL algorithm) and manual measurements. Bland‐Altman plot for ST‐elevation (top) and ST‐depression (bottom). SD, standard deviation.

Agreement between automated ST‐segment measurements (Marquett 12SL algorithm) and manual measurements. Bland‐Altman plot for ST‐elevation (top) and ST‐depression (bottom). SD, standard deviation.