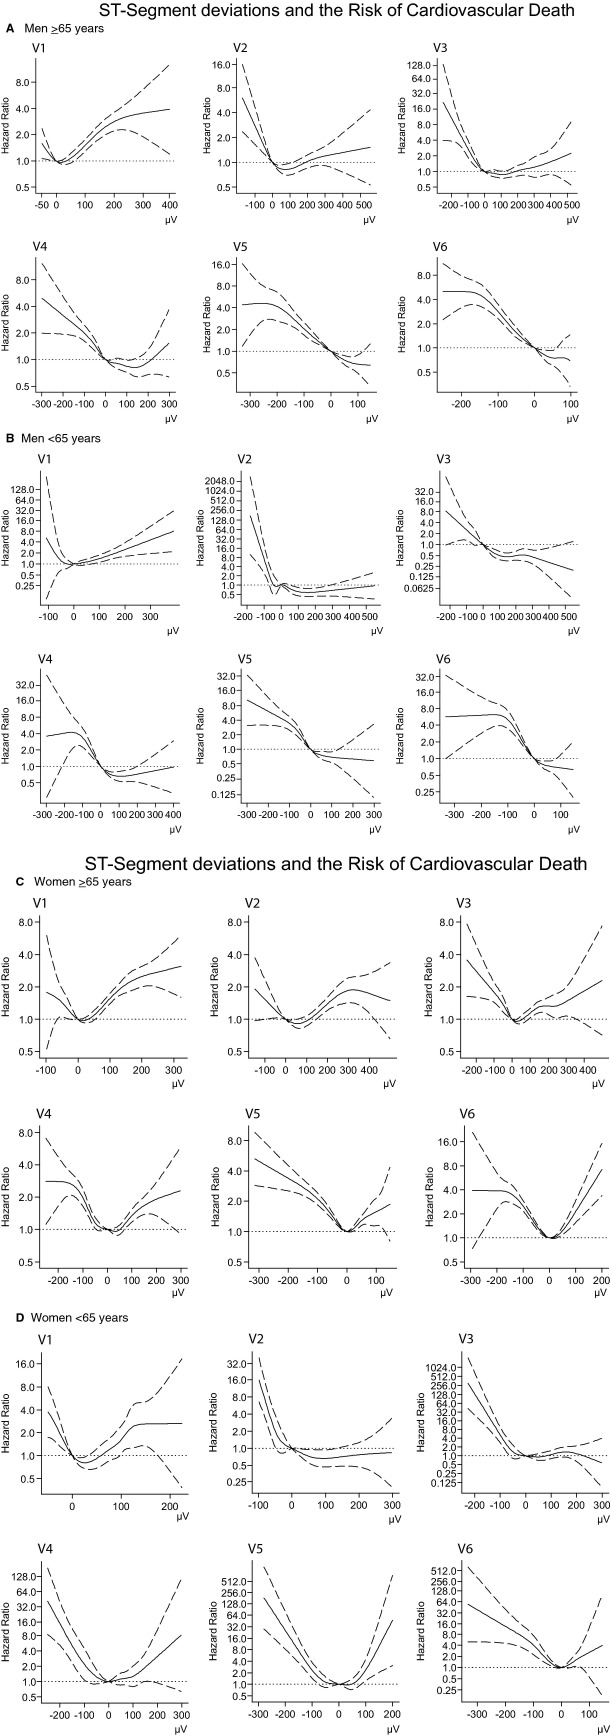
Figure 6.
Restricted cubic regression splines depicting the association between the ST‐segment amplitude and the risk of CVD based on cox regression models adjusted for the same covariates as the categorical analysis (see Methods). Note the different axes due to variation between leads. A, Men, old (≥65 years); (B) Men, young (<65 years); (C) Women, old (≥65 years); (D) Women, young (age <65 years).

