Figure 1.

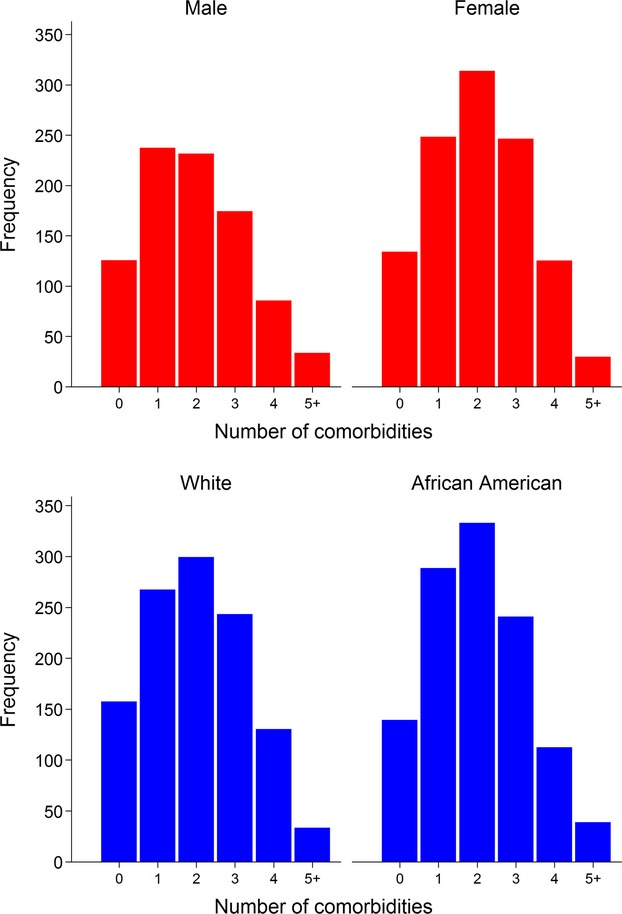
Histogram plots of number of comorbidities stratified by sex and race. Stratified by sex (top panel) and race (bottom panel). There were no significant differences in number of comorbidities by sex (P=0.07) or race (P=0.58).

Histogram plots of number of comorbidities stratified by sex and race. Stratified by sex (top panel) and race (bottom panel). There were no significant differences in number of comorbidities by sex (P=0.07) or race (P=0.58).