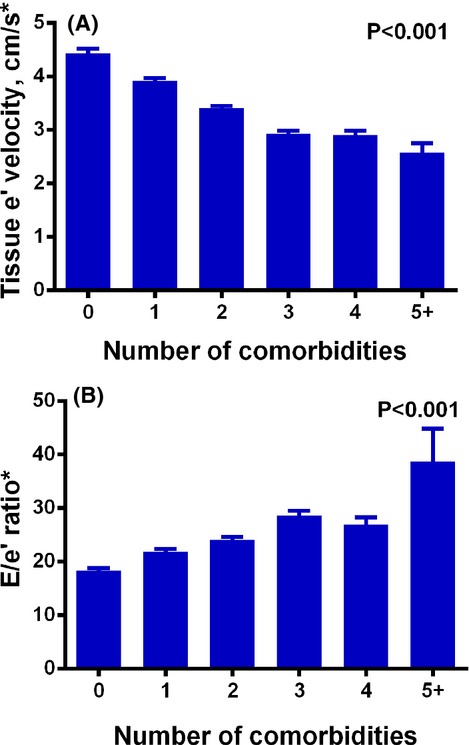
Figure 3.

Bar graphs of number of comorbidities vs diastolic parameters. Increasing comorbidity burden is associated with worsening e' velocity (A) and progressively increased E/e' ratio (B), an index of increase left ventricular filling pressure. P values represent significance for the trend across number of comorbidities. Error bars represent standard errors. *Values for speckle tracking‐derived e' velocity are lower (and therefore E/e' are higher) than those obtained clinically (via tissue Doppler imaging).
