
Figure 2.
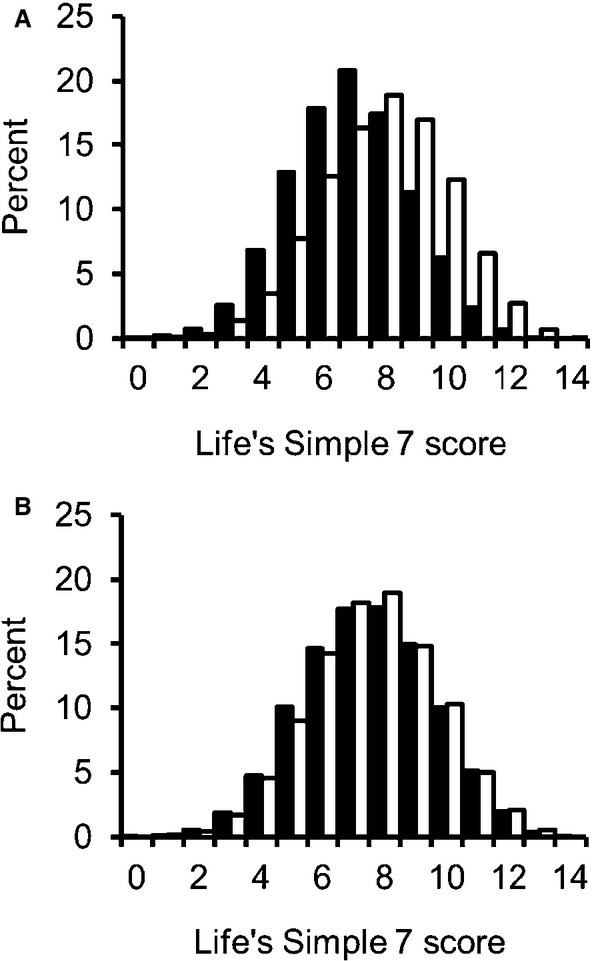
Unadjusted distributions of Life's Simple 7 score. A, Distributions by race: blacks (solid bars), whites (open bars). B, Distributions by geographic region: within the stroke belt (solid bars), outside the stroke belt (open bars).
Official websites use .gov
A
.gov website belongs to an official
government organization in the United States.
Secure .gov websites use HTTPS
A lock (
) or https:// means you've safely
connected to the .gov website. Share sensitive
information only on official, secure websites.
Unadjusted distributions of Life's Simple 7 score. A, Distributions by race: blacks (solid bars), whites (open bars). B, Distributions by geographic region: within the stroke belt (solid bars), outside the stroke belt (open bars).