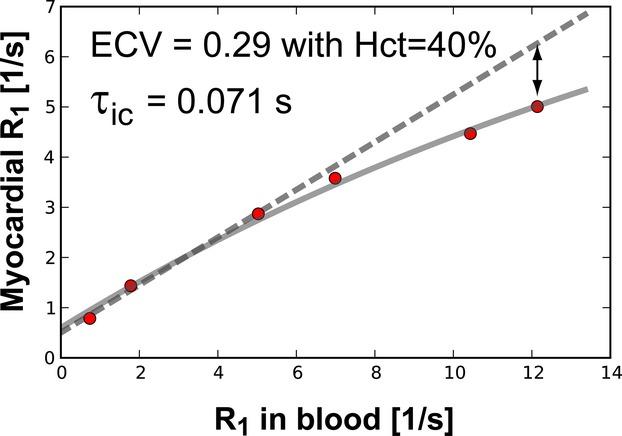
Figure 1.

Illustration of dependence of myocardial R1 on R1 in blood. This example is from a study in a mouse at follow‐up after treatment with l‐NAME and spironolactone. The dashed line corresponds to the standard method of determining ECV from the ratio of the change of R1 in myocardial tissue divided by the change of R1 in blood (a linear model). At higher contrast concentrations the myocardial R1 increases more slowly than predicted by this linear model, because the exchange of water across the sarcolemmal membrane becomes the rate‐limiting step for myocardial relaxation, thereby resulting in a myocardial R1 that is lower than expected for fast exchange conditions (double arrow). ECV and intracellular lifetime were determined by a 2‐space model of water exchange across the (sarcolemmal) membrane between the 2 spaces. ECV indicates extracellular volume; l‐NAME, Nω–nitro‐l‐arginine‐methyl‐ester.
