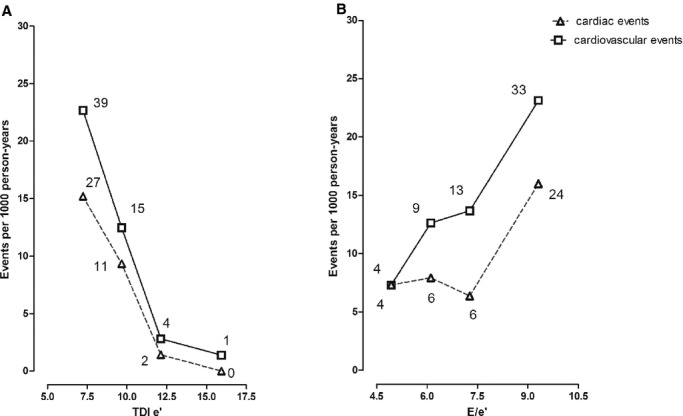
Figure 2.

Incidence rates of fatal and nonfatal cardiovascular and cardiac events by quartiles of the distributions of the tissue Doppler imaging (TDI) e' velocity (A) and E/e' ratio (B) in 793 participants. Incidence rates were calculated as number of events per 1000 subject/year and were standardized for sex and age (age groups: <40 years; 40 to 60 years; >60 years) by the direct method. The number of endpoints contributing to the rates is shown. P values are for trend.
