
Figure 5.
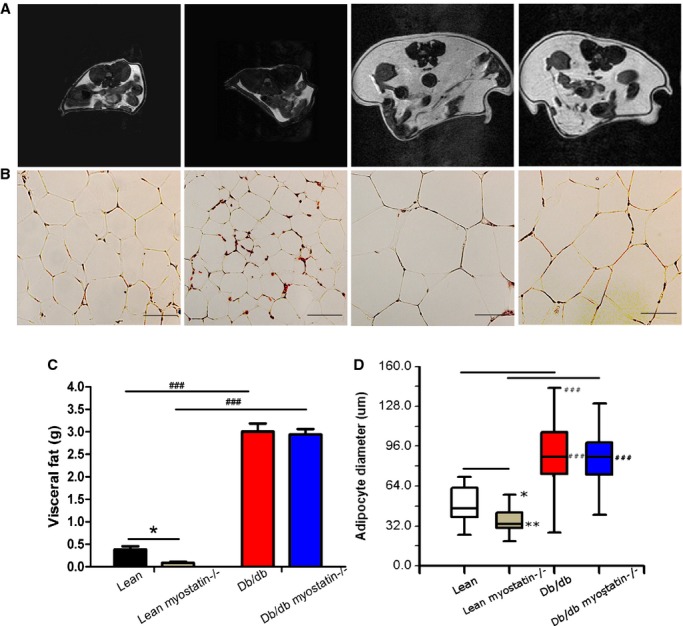
Deletion of myostatin reduces fat mass in lean, but not obese, mice. A, Abdominal axial T1‐weighted cross‐section of MRI scan; adipose tissue is shown in white (n=3). B, Hematoxylin and eosin (H&E) staining for visceral fat (×200); bars represent 50 μm. A and B, From left to right: lean, lean myostatin−/−, db/db, and db/db myostatin−/− (n≥8). C, Visceral fat weight of all the genotypes (n≥8). D, Quantification of representative H&E‐stained cryosections, presenting as box‐and‐whisker plots comprising minimum, median, and maximum value for adipocytes diameter (n≥8). *P<0.05; **P<0.01, lean myostatin−/− versus lean or db/db myostatin−/− versus db/db; ###P<0.001; db/db versus lean or db/db myostatin−/− versus lean myostatin−/−. Data are shown as mean±SEM. db/db myostatin−/− indicates mice lacking both myostatin and leptin receptor; db/db, obese leptin receptor‐deficient mice heterozygous for myostastin; lean myostatin−/−, myostatin‐null mice heterozygous for leptin receptors; lean, lean dual heterozygotes; MRI, magnetic resonance imaging.