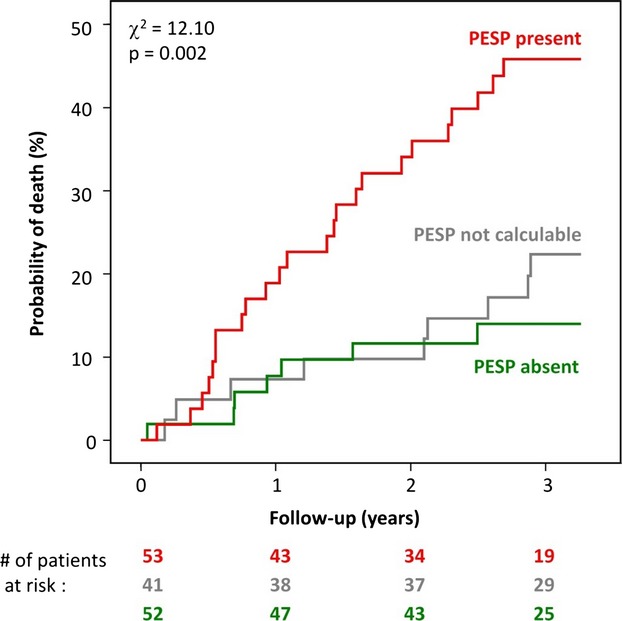
Figure 5.

Validation cohort: Kaplan‐Meier curves for the association of PESP and mortality. Mortality probability over the follow‐up period in patients stratified according to PESP presence (red curve) and absence (green curve). Mortality probability of patients in whom PESP was not evaluable is also shown (gray curve). The numbers of patients of the 2 groups involved in the analysis at 0, 1, 2, and 3 years are shown below the graph in the same color coding. P values for the overall comparison at 3 years are indicated. PESP indicates postextrasystolic potentiation.
