
Figure 2.
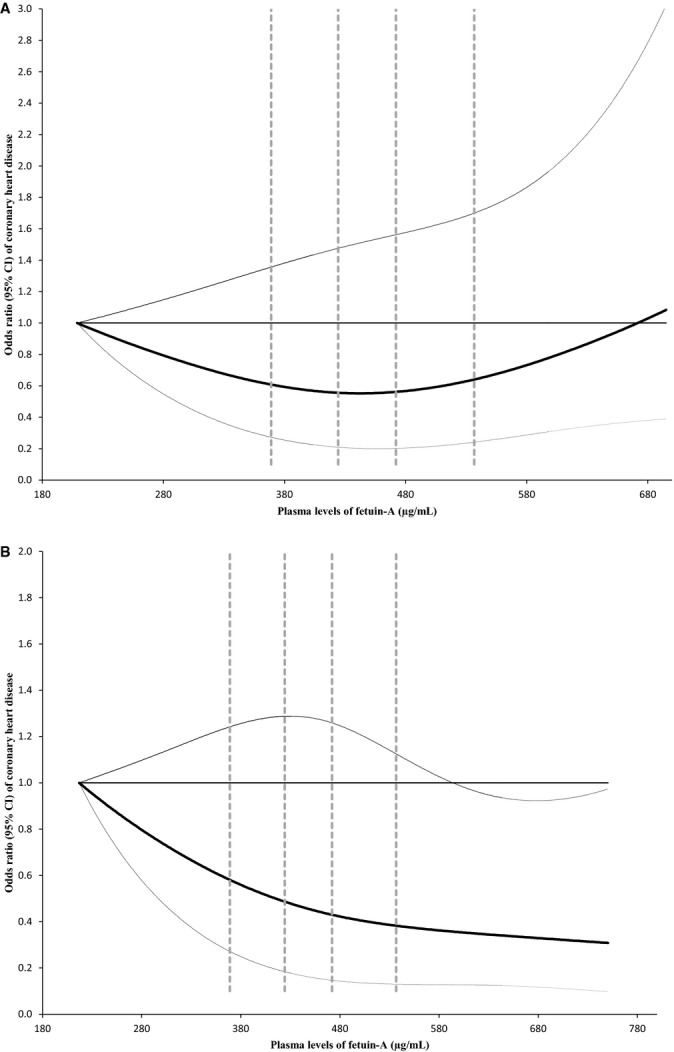
Dose‐response relationship between fetuin‐A levels and CHD risk stratified by plasma hsCRP levels. Study participants with the lowest and highest 1% of fetuin‐A were excluded to minimize potential impact of outliers. Multivariate logistic regression models were adjusted for the same set of covariates for model 3 in Table 3, as well as matching factors. Solid lines are ORs and dashed lines are 95% CIs. The horizontal line is the reference line, and the dotted vertical lines are cut‐off points for making quintiles. A, hsCRP levels below median (0.20 mg/dL); (B) hsCRP levels above median. CHD indicates coronary heart disease; hsCRP, high‐sensitivity C‐reactive protein; ORs, odds ratio.