
Figure 3.
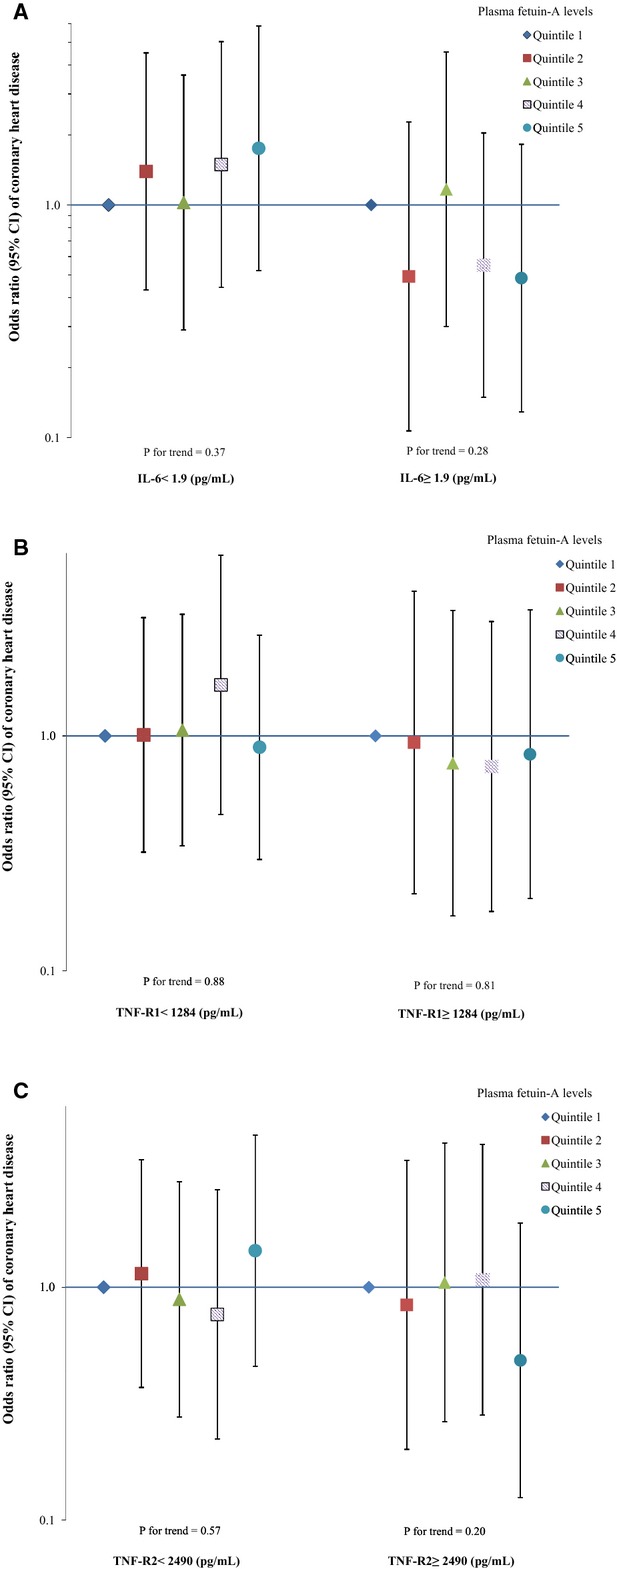
Odds ratio (95% CI) of coronary heart disease for plasma fetuin‐A levels by other inflammatory marker concentrations. Multivariate logistic regression models were adjusted for the same set of covariates for model 3 in Table 3, as well as matching factors. The Y axis was on log scale. A, interleukin‐6 (IL‐6), n=387; (B) tumor necrosis factor, receptor 1 (TNF‐R1), n=404; (C) tumor necrosis factor, receptor 2 (TNF‐R2), n=404.