
Figure 5.
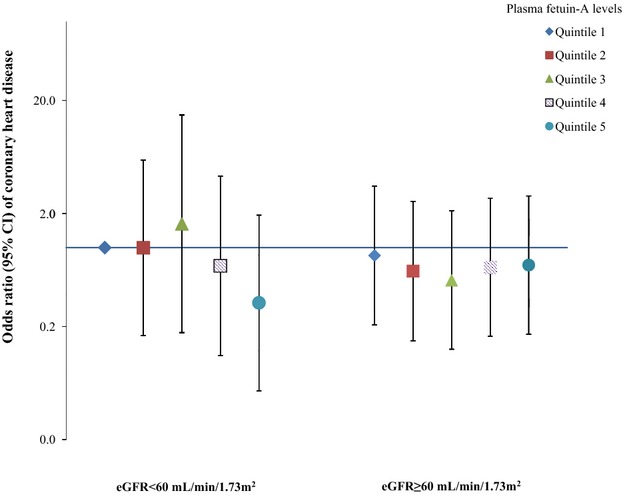
Odds ratio (95% CI) of coronary heart disease for joint categories of plasma fetuin‐A levels and estimated glomerular filtration rate. Multivariate logistic regression models were adjusted for the same set of covariates for model 3 in Table 3. The Y axis was on log scale.