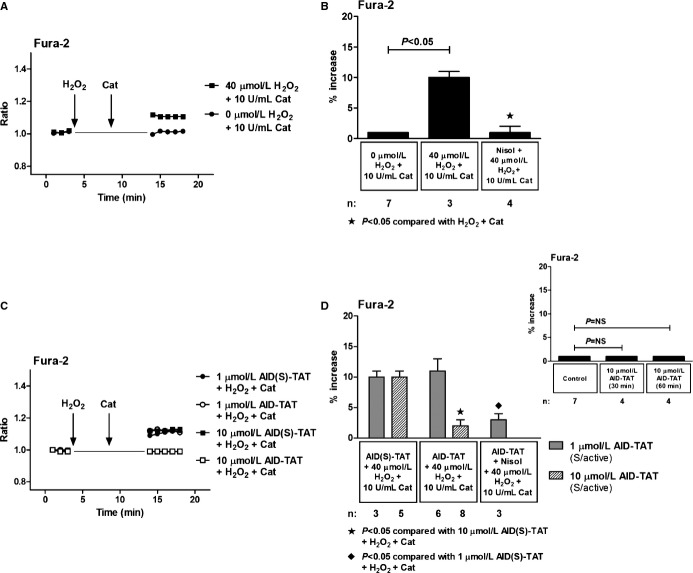
Figure 3.
Effect of AID‐TAT peptide on calcium influx in vitro. A, Representative traces of ratiometric Fura‐2 fluorescence recorded in a myocyte before and after 5 minutes of exposure to 40 μmol/L of H2O2 followed by 5 minutes of exposure to 10 U/mL of catalase and a myocyte before and after 5 minutes of exposure to 0 μmol/L of H2O2 followed by 5 minutes of exposure to 10 U/mL of catalase. Vertical arrows indicate when drugs were added. B, Mean±SEM of changes in ratiometric Fura‐2 fluorescence for all myocytes exposed to 40 μmol/L of H2O2, 10 U/mL of catalase, and 10 μmol/L of nisoldipine (Nisol) as indicated. C, Representative traces of ratiometric Fura‐2 fluorescence recorded in myocytes before and after 5 minutes of exposure to 40 μmol/L of H2O2 followed by 5 minutes of exposure to 10 U/mL of catalase in the presence of either 1 or 10 μmol/L of AID(S)‐TAT or AID‐TAT peptide as indicated. Vertical arrows indicate when drugs were added. D, Mean±SEM of changes in ratiometric Fura‐2 fluorescence for all myocytes exposed to 40 μmol/L of H2O2, 10 U/mL of catalase, 1 or 10 μmol/L of AID(S)‐TAT or AID‐TAT peptide, and 10 μmol/L of nisoldipine (Nisol) as indicated. Statistical significance was determined using the Kruskal‐Wallis test followed by Dunn's multiple comparison test. Inset above: mean±SEM of changes in ratiometric Fura‐2 fluorescence for myocytes before and 30 and 60 minutes after exposure to 10 μmol/L of AID‐TAT peptide as indicated. AID indicates alpha‐interacting domain; TAT, transactivator of transcription.

