
Figure 4.
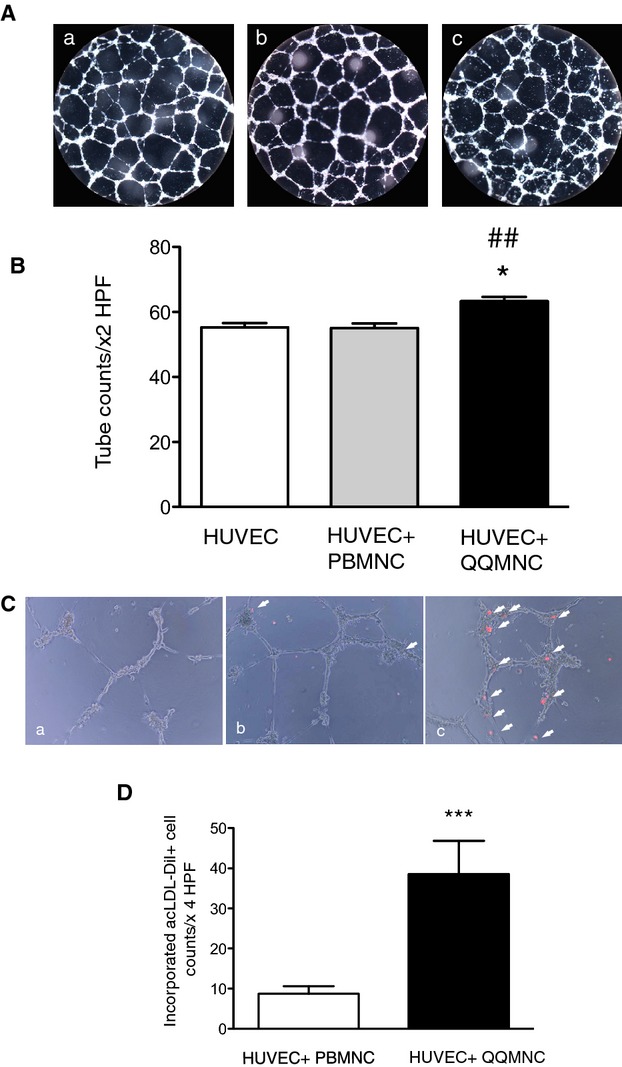
In vitro angiogenic assay of HUVECs cocultured with QQMNCs. A, Features of tubes formed by HUVECs. B, The bar graphs represent the number of tubes counted under ×2 HPF. *P<0.05 versus HUVEC; ##P<0.01 versus HUVEC+PBMNC. C, Incorporation of acLDL‐DiI uptaking PBMNCs or QQMNCs into tubes of HUVECs. Arrow heads indicate PBMNCs or QQMNCs that are labeled with acLDL‐DiI and incorporated into tubes formed by HUVECs. (a) HUVEC alone, (b) HUVEC+PBMNC, and (c) HUVEC+QQMNC in (A and C). D, The bar graphs show numbers of incorporated PBMNCs or QQMNCs, counted under ×4 HPF. ***P<0.001. Each graph column represents a mean±SE. N=10 wells/group. acLDL‐DiI indicates acetylated low density lipoprotein, labeled with 1,1′‐dioctadecyl‐3,3,3′,3′‐tetramethyl‐indocarbocyanine perchlorate; HPF, high power field; HUVECs, human umbilical vein endothelial cells; PBMNCs, peripheral blood mononuclear cells; QQMNCs, quality and quantity control culture of mononuclear cells.