
Figure 10.
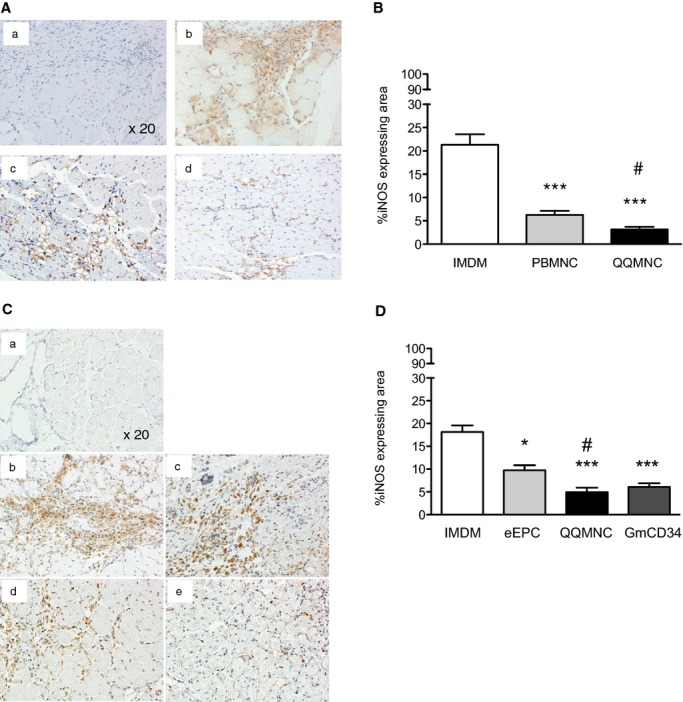
Histological evaluation of inflammation in ischemic hindlimbs. A and C, Representative pictures of inflammation in ATM by immunohistochemistry using anti‐iNOS antibody (brown color) in each group. ×20 HPF. (a) Control of rabbit polyclonal IgG, (b) IMDM control, (c) PBMNCTx, and (d) QQMNCTx in (A). (a) Control of rabbit polyclonal IgG, (b) IMDM control, (c) eEPCTx, (d) QQMNCTx, and (e) GmCD34Tx in (C). B and D, The graphs show percent (%) iNOS expressing area in each group. *P<0.05; ***P<0.001 versus IMDM control in (B and D). #P<0.05 versus PBMNCTx in (B) or eEPCTx in (D). Each graph column represents a mean±SE. N=6 mice per group. ATM indicates anterior tibial muscle; eEPCTx, early endothelial progenitor cell transplantation; GmCD34, granulocyte colony‐stimulating factor mobilized CD34+ cell; HPF, high power field; iNOS, inducible nitric oxide synthase; PBMNCTx, peripheral blood mononuclear cell transplantation; QQMNCTx, quality and quantity control culture of mononuclear cell transplantation.