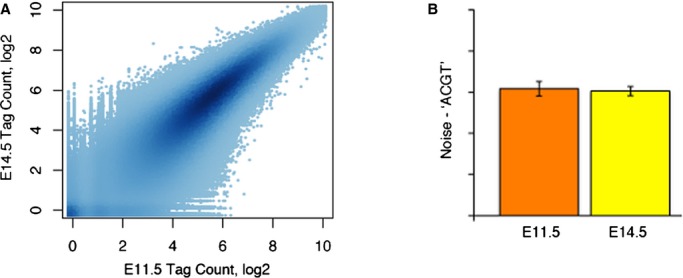
Figure 1.

Limited DNA methylation changes between E11.5 and E14.5 hearts. A, The tag counts for all ACGT sites in E11.5 (x‐axis) and E14.5 (y‐axis) are highly correlated. The depth of the color represents the density of points in a plotting area (n=2). B, Confirmation of stable global methylation by Luminometric Methylation Assay (LUMA) (n=2). Error bars represent standard error.
