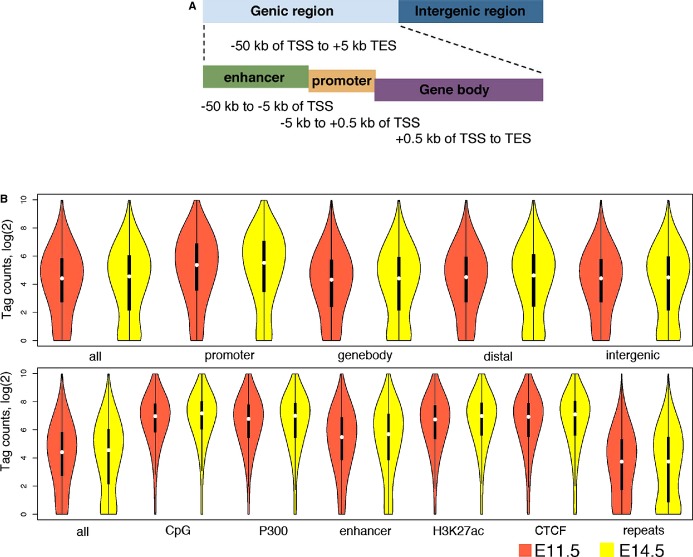
Figure 2.
Distribution of DNA methylation across the mouse genome and various types of genomic elements in the developing heart. A, Cartoon depicting the genic regions (enhancer, promoter and genebody). B, Violin plot (a combination of a box plot and a kernel density plot) showing the distributions of tag counts for all ACGT (top) or differential methylated (bottom) sites in different genomic regions. As number of tag counts is inversely correlated to level of CG methylation, these plots indicate that gene promoters and regulatory regions exhibit significantly lower levels of DNA methylation than genomic background, and repetitive sequences are highly methylated. Plots in orange and yellow are for data from E11.5 and E14.5, respectively. TES indicates transcription end sites; TSS, transcription start sites.

