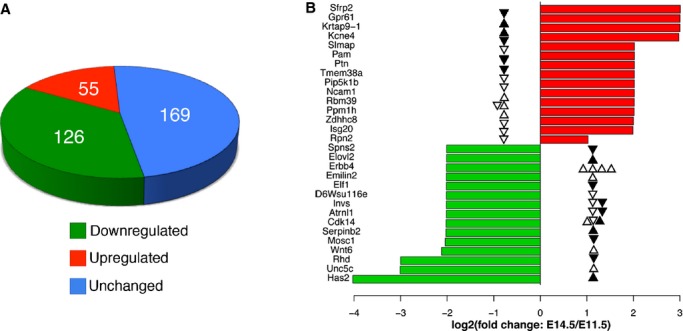
Figure 5.

Expression changes for selected genes with differentially methylated sites. A, Gene expression analysis (n=3) of 350 differentially methylated genes between E11.5 and E14.5 showing that 181 genes are differentially expressed and 79 of those genes show consistent changes in DNA methylation. B, The top 15 upregulated genes (red) and downregulated genes (green) in E14.5. The solid and open triangles mark differentially methylated sites in regulatory regions (promoter proximal or distal) and gene bodies, respectively. The up and down directions of triangles indicate increased and decreased methylation, respectively.
