
Figure 2.
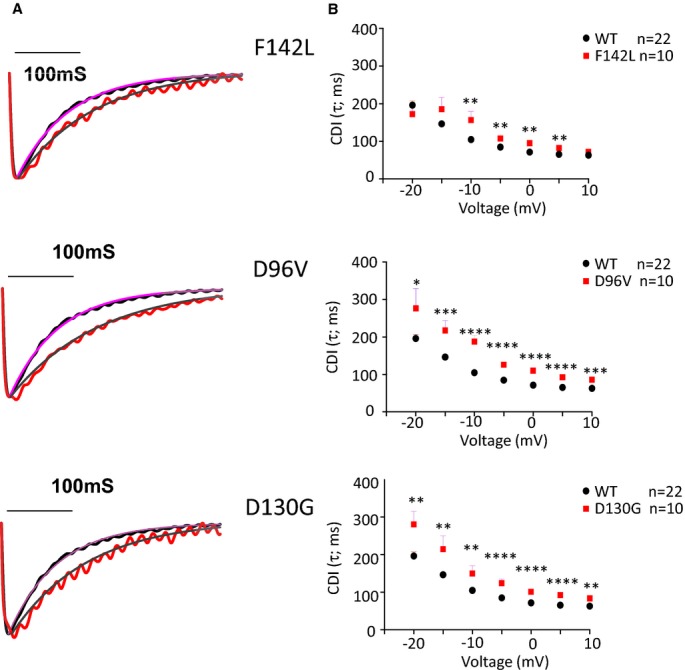
Long QT syndrome (LQTS) calmodulin (CaM) mutants slow CDI. A, Representative traces recorded during a depolarization to 0 mV. The single exponential fit of a representative WT CaM current sweep (dotted line) is illustrated for reference. The smooth line through the current traces is a single exponential fit of the form: I(t)=Ipeak*e−t/τ. B, Inactivation time constant (τ) plotted as a function of voltage. For clarity, the WT CaM data are illustrated along with each LQTS‐CaM mutation plot. **P<0.01; ****P<10−4. CDI indicates Ca2+‐dependent inactivation; WT, wild type.