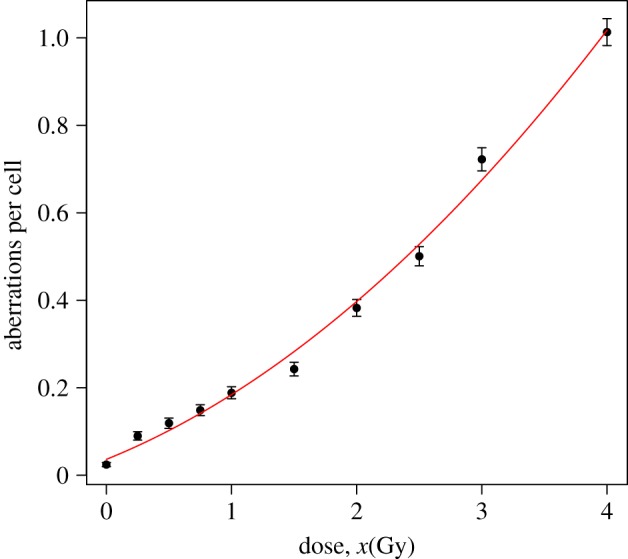
Figure 4.

Observed means (dots), plus/minus twice their standard errors (error bars), and predicted means (solid line) of the number of micronuclei for NB fitting, based on the data in table 5, omitting the 0.1 Gy test data. (Online version in colour.)
