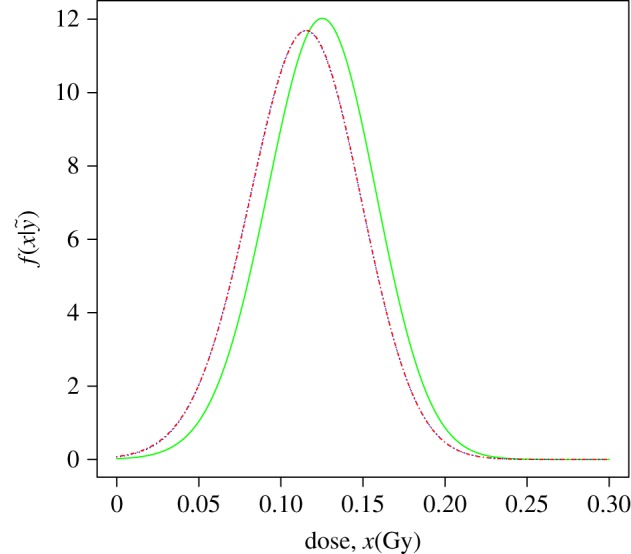
Figure 5.

Calibrative densities of the 0.1 Gy test data using the complete model (2.5) (green/solid line), and the simplified ones with a normal (blue/dotted line) and a gamma (red/dashed-dotted line) mean prior density; all with a uniform prior dose distribution. Blue and red curves are indistinguishable.
