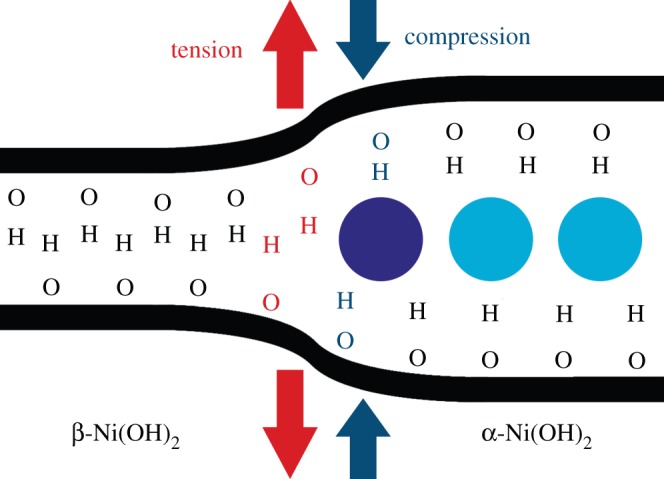
Figure 10.

Representative schematic of the boundary between the α- and β-Ni(OH)2 phases during chemical ageing showing the mechanical forces near the α/β boundary. These forces correspond to observed blue- and red-shifts in the frequencies of various lines in the Raman spectra of partially aged samples. Figure reproduced with permission from [94]. (Online version in colour.)
