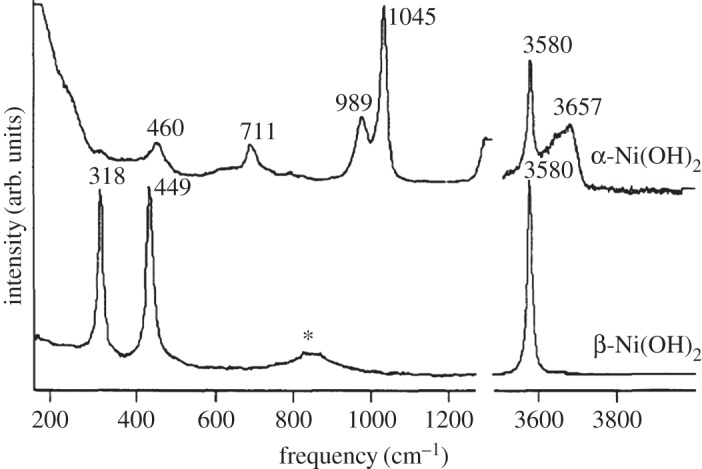
Figure 13.

Raman spectra of nitrate-intercalated α-Ni(OH)2 and β-Ni(OH)2 showing lower frequency modes. The α-phase sample also contained some β-Ni(OH)2, as evidenced from the strong peak at 3580 cm−1, owing to the difficulty of preparing high purity α-Ni(OH)2. The peaks annotated with an asterisk (*) are spurious peaks arising from the instrument objective. Reproduced with permission from Johnston C & Graves PR, 1990 [227], In situ Raman spectroscopy study of the nickel oxyhydroxide electrode (NOE) system. Appl. Spectrosc. 44, 105–115.
