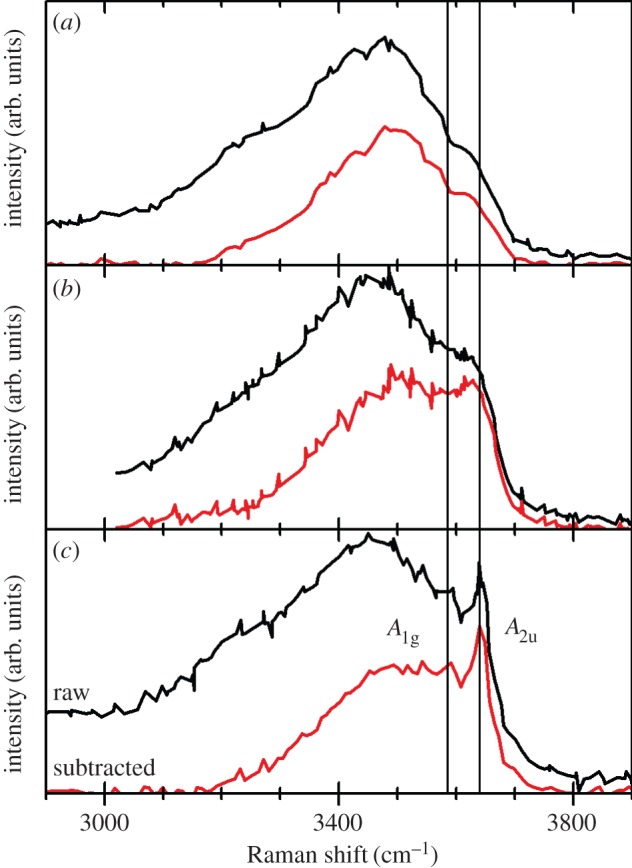
Figure 18.

The in situ SERS measurements of Melendres & Pankuch (fig. 5(a)–(c) in [193]) were first digitized (upper curves, black) and then the background fluorescence and water components were removed (lower curves, red) using the method illustrated in figure 17. Copyright this work. (Online version in colour.)
