Figure 20.

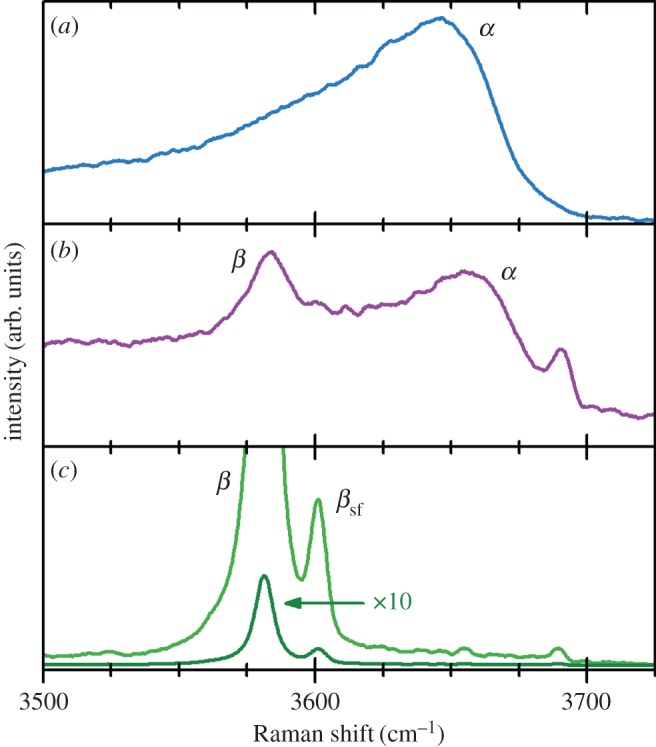
Raman spectra, plotted on the same intensity scale, showing the O−H internal modes of samples (a) α-Ni(OH)2, (b) mixed α/β-Ni(OH)2 and (c) β-Ni(OH)2. Copyright this work. (Online version in colour.)

Raman spectra, plotted on the same intensity scale, showing the O−H internal modes of samples (a) α-Ni(OH)2, (b) mixed α/β-Ni(OH)2 and (c) β-Ni(OH)2. Copyright this work. (Online version in colour.)